The Confusion Matrix is extremely important in evaluation of model performance for classification model. What we plan to described in this article are the derived (advanced) classification metrics from the confusion matrix.
- True positive rate (TPR) – Recall
- True negative rate (TNR)
- Positive predictive value (PPV) – Precision
- Negative predictive value(NPV)
- False positive rate (FPR)
- False negative rate (FNR)
- Informedness
- Markedness
- F1 score
- Matthews Correlation Coefficient (MCC)
- ROC Curve
- Precision Recall Curve
Let’s first recap the definition of the confusion matrix (class1=True, class0=False):

True positive rate (TPR) – popularity: ★★★★

Also known as sensitivity, recall, and hit rate, it is the probability that an actual instance of class 1 is correctly identified by the model.
True negative rate (TNR) – popularity: ★★

Also known as specificity, it is the probability that an actual instance of class 0 is correctly identified by the model
Positive predictive value (PPV) – popularity: ★★★★

Also known as precision, it is the probability that it is of class 1 when the model says it is of class 1.
Negative predictive value (NPV) – popularity: ★★

It’s the probability that it is of class 0 when the model says it is of class 0.
False positive rate (FPR) – popularity: ★★★★

It’s the probability that the model says it is of class 1 when the actually it is of class 0.
False negative rate (FNR) – popularity: ★★★

It’s the probability that the model says it is of class 0 when the actually it is of class 1.

Next we move on to more advanced metrics
Informedness = TPR + TNR – 1
Also known as Youden’s J static, it captures both TPR and TNR and has a range from -1 to +1. 0 means random guess, 1 means perfect prediction, -1 means always wrong prediction.
Markedness = PPV + NPV – 1
It combines PPV and NPV, and it seems analogous to informedness. It also has the same range from -1 to +1. The informedness says how well each class is being predicted by the model, while the markedness says how correct the model is when claiming a particular label.
F1 Score – popularity: ★★★★★

This is one of the most popular metric. It is the harmonic mean of the precision and recall. It has a slight emphasis on the class 1 because both precision and recall are metrics of either predicting class 1 or actually being of class 1.
Matthews Correlation Coefficient – popularity: ★★

This looks quite overwhelming, but it can be thought of as the geometric mean of the informedness and markedness. It’s favored by statistician over the F1 score because MCC takes in the entire 2×2 confusion matrix into account.
The last 2 popular classification metrics are curves!
ROC Curve
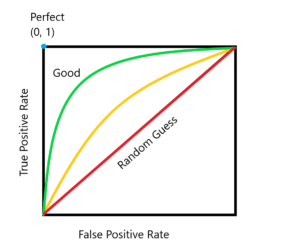
The Receive operation characteristic (ROC) curve is a parametric curve what you plot the false positive rate (FPR) against the true positive rate (TPR). In practice the curve is generated by varying the threshold of the classification model from 0 to 1.0, which is knob that controls how many samples will be classified as class 1 vs class 0.

As shown in the chart, the model has the best performance when its ROC curve is close to the upper left corner, which represent TPR=100% and FPR=0%.
Precision Recall Curve
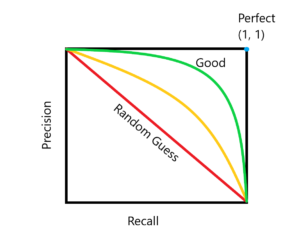
The precision Recall curve is very similar to the ROC curve but it’s plotted with Recall against Precision.

When the precision=100% and recall=100%, it’s a perfect classifier.
ROC curve vs Precision Recall (PR) curve
As the last two advance classification metrics, these two curves seems quite similar but they evaluate the model from very different angles.
The ROC curve shows a trade-off between the TPR=TP/(TP+FN) and FPR=FP/(FP+TN) which can be described as trading the model’s performance in predicting data that is actually class 1 vs class 0:

The PR curve show a trade-off between the Precision=TP/(TP+FP) and Recall=TPR=TP/(TP+FN), which is much more focused on trading of model’s performance on predicting class 1 correctly:
- Predicting class 1 correctly over all samples are actually class 1
- Predicting class 1 correctly over all cases when the model predicts class1
It’s a balanced view on evaluating Class 1 and Class 0.

It might be quite hard to read the blue and green boxes that I draw over the confusion matrix, but the point it show that the PR curve is heavily weighted to evaluation on class 1 performance.
Question: Why would we want to favor class 1?
Answer: It’s common to have imbalanced data (ie. cancer testing) where class 1 (detecting cancer) is much more rare than class 0 (healthy). We care much more about the performance on class 1 in this case.
2 thoughts on “Advanced Classification Metrics: Precision, Recall, and more”