For beginners
I would like t give an explanation for beginner to understand the basis of hypothesis testing and I have tag various section with “[important]” prefix to signal where to focus on.
- You can probably heard about hypothesis testing but want to understand it more intuitively.
- You used formula to calculate a z-statistic in a z-test but cannot explain the reasoning.
- To understand the significance level when setting up the test
- To understand the p-value to interpret a test result
Choose the Type of test
- Many types of test such as z-test, t-test, f-test, etc
- The z-test is a called one-sample location test, which simply means it compares the location parameter (ie, the mean) of one sample to a given constant.
- Determines the underlying distribution to use (it should reasonable assumption about the data, ie. normal distribution for z-test)
Choose the Null Hypothesis
- The “step 1” in setting up a hypothesis test
- Typically is the default decision if no strong evidence is found
- A type of conjectures in a statistical test
- A way to reaching a conclusion on the basis of the data
- Assumed to be true at the start of the test
- In a z-test, the null hypothesis is usually a statement about the mean of X equals to a prespecified constant
- ex:

- ex:
Alternative Hypothesis
- Another type of conjectures in a statistical test that is opposite of the null hypothesis.
- Or another hypothesis that you would choose to accept if the null hypothesis is rejected
- For a z-test, which is a one-sample location test
- ex:

- ex:
Compute estimate of a parameter from the sample (ex: mean)
- This is typically easy to compute
- Ex: the estimate is the mean of the sample
- A sample has a very specific meaning here:
- It’s the collection of records that you collected.
- For example, if you are measuring average price of houses by collecting 200 houses. The 200 houses prices are one sample. It has a sample mean.
- Don’t be confused with the misunderstanding of the sample as one house price from the entire population of house prices.
- There is an important point to under in building intuition that this sample mean comes from a distribution, that is, it’s a realization of a random variable as well.
- If the experiment is repeated and the sample is re-drawn, you are collecting 200 house prices against as one new sample. From the new 200 house prices, there is a new sample mean.
- If this experiment is repeated over and over, it’s as if you are drawing repeated samples from the distribution that represent the sample mean of a collection of 200 houses.
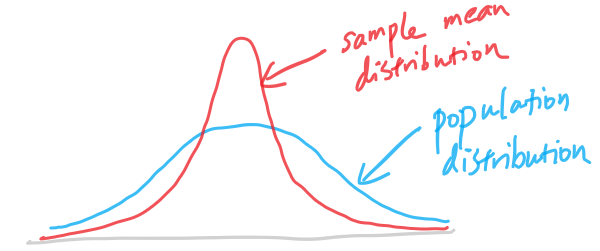
Population distribution vs sample mean distribution
- This is something that confuses people often.
- Population distribution represents the distribution when only one record is drawn from the population.
- A sample = 1 house price record
- Sample mean distribution represent how the mean of the sample of 200 houses is drawn as one sample each time
- A sample = 200 house prices
- If you compare their distributions,
- The population distribution always have a more spread out distribution. In this case, we assume it’s a bell curve.
- Then the sample mean distribution would have a more concentrated probability around the center of the bell curve
- Note to note:
- They have the same mean (same locations for the center of the bell curve)
- The sample mean distribution has smaller variance (and standard deviation). The large the sample size (200 house prices in this example), the smaller the variance. This makes intuitive sense as you have more number to average, there should be small variability when you repeat the experiment to redraw the sample.
[Important] Choose a significance level (alpha)
- The probability of rejecting the null hypothesis even when it is true
- Corresponds to the false positive rate (see confusion matrix)
- This step actually happens before computing the estimate from the sample, but I am putting this section after because it’s harder to understand if we put this at the beginning.
- Let’s set alpha = 5% as a common practice. This mean if we repeat the experiment 100 times, we would reject the null hypothesis 5% of the time even when the null hypothesis is true.
- Example: z-test at 5% significance level

- Let’s say we compute the z-score = 5 in this z-test
-
-

- Under the null hypothesis, the probability of observing an z-score as extreme as 5 is lower than 1 in a million (probability of 5.73e-7). Note in the graph above, we account for the probability of greater than 5 and less than -5 when we say “as extreme as” because we consider value away from the peak of the bell curve to be unlikely values to observe.
- At such low probability of occurring, is it still reasonable to believe the null hypothesis is true? Do you believe that we get so unlucky to draw a value that is so far from the peak?
- Without any other evidence, one statistical reasoning here would be that the null hypothesis is not true because if the null hypothesis is true, it’s very unlikely to observe this estimate.
- Can we be wrong? Yes, we can definitely be wrong. Under the null hypothesis, we might be wrong 5.73e-7 of the time, but we are willing to take our chance and reject the null hypothesis because 5.73e-7 is less than 5%.
- So the significance level at 5% means that we are willing take a risk of at most 5% to falsely reject the null hypothesis when it’s in fact true.
- This sounds bad, right? Why do we want to reject something that is true?
- Can we just have 0% significance? Yes, then we basically cannot reject the null hypothesis any time that probability of the sample mean is non-zero. However, under the null hypothesis, the sample mean is drawn from a normal distribution which mean it has a non-zero probability from negative-infinity to positive-infinity.
- To avoid ever incorrectly rejecting the null hypothesis when it’s true (ie. achieve significance level = 0%), we basically cannot reject the null hypothesis from negative-infinity to positive-infinity. There is little use of such a test.
- It means even if the evidence is strong against the null hypothesis. In the example above, happening at a probability of 0.0000005 under the null hypothesis, we still choose to believe the hypothesis is true.
- This is equivalent of being very stubborn on believe that null hypothesis when if fact the null hypothesis might be just wrong. Maybe the mean of the bell curve should be at 5 instead? In that case, it would have a very high chance of getting a sample mean of 5.
-
Convert the estimate to a test statistic (ex: z-statistic)
- Often the estimate (ie. sample mean) is not a standardize score, so we apply a transformation on the estimate to turn it into standardized statistic
- For z-test, this standardized statistic is called the z-score. Basically this is just a number to use to compare to a critical value (threshold) later
- In the z-test, the z-score formula is given below

- The denominator (sigma x-bar) is the standard deviation of the sample average
- The standard deviation of the sample average is the standard deviation of the population divided by square root of sample size.
- In practice, we often don’t know the true standard deviation of X or the true standard deviation of the sample mean (X bar), so we replace the standard deviation of the mean value of the sample with the standard error of the mean to carry on the z-test.

- Both the “SE” and “s” are notation to mean standard error as an estimate of the standard deviation.
- The standard deviation of the population is estimated using the formula of sample standard deviation
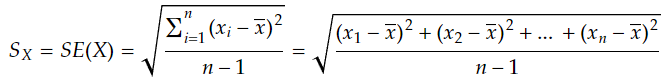
- People often refer to above as the “population standard deviation” even though it’s an estimate of it.
- Next calculate the standard deviation of the sample mean (aka. standard error of the mean)
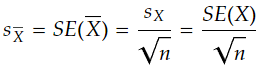
- People sometimes just refer to above as the “standard error” when what they really mean is the “standard error of the sample mean” or “estimate of the standard deviation of the sample mean”.
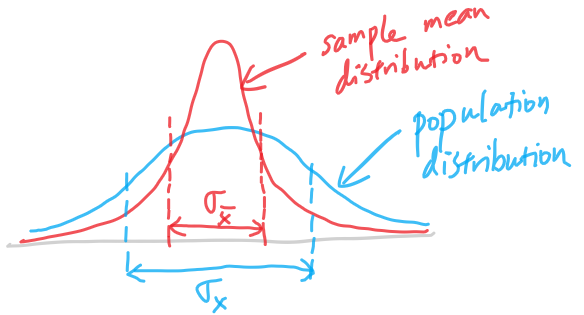
- The difference can be illustrated like below (see the different sigmas for each distribution)
- Example:
- Null Hypothesis: the mean house price =400,000.
- We have collected the house prices of 200 houses
- Based on this sample of 200 houses
- the sample average is 430,000
- the standard deviation of the population is 100,000
- the standard deviation of the sample mean (aka. standard error of the mean) is 10,000/sqrt(200) = 7071
- z-score = (430,000 – 400,000)/7071 = 4.24
- The standardized score makes it easier to compared to the common critical value (see next section)
[Important] Compute and interpret the test result
There are generally two ways to obtain the test results
- Compare the standardized statistic against the critical value
- Ex: continuing from the earlier house prices (z-score = 4.24)
- For a z-test with alpha=5%, the critical value is -1.96 and +1.96. This means we reject the null hypothesis if the z-score is below -1.96 or above 1.96. If the computed z-score is 4.24, since 4.24 is larger than 1.96, the decision is to reject the null hypothesis.
- Note that the significance level (alpha) 5% is related with the critical values of -1.96 and 1.96 because of below relationship.
- Note that 4.24 will fall in the red rejection region
- Ex: continuing from the earlier house prices (z-score = 4.24)
- Compare the p-value to significance level
- Ex: in the earlier example, a z-score of 4.24 actually correspond to a point very far to the right side of the curve
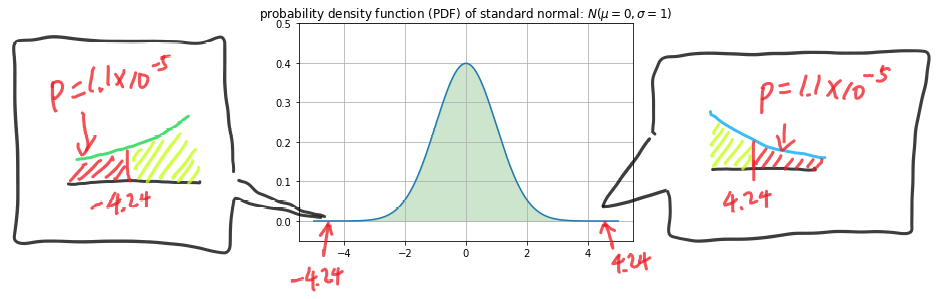
- In fact, it’s so far to the right that the probability of sampling a value more than 4.24 is 1.1e-5 (1 in 100,000). By also accounting the left side where the value is lower than -4.24, the p-value in this case is 2*1.1e-5 = 2.2e-5.
- This p-value is interpreted as: under the null hypothesis, there is a 2.2e-5 probability of getting a z-score as extreme as 4.24 (both on positive and negative sides)
- Since the p-value is below 5%, the decision is to reject the null hypothesis.
- Does it sound familiar to you? Because you read about this in the earlier section about significance level!
- In fact, the significance is just a threshold for p-value. We decide the significance level (alpha) before the test, and the calculate the z-score from the data collection to get the p-value, and then we can make a decision.