Summary
Machine learning (ML) in production is quite different from ML in a Kaggle competition. One of the biggest difference is in the data sets.
- Kaggle data sets are always static. You are given a fixed data set for training and you will be evaluated on a fixed data during testing/evaluation.
- Production data tends to be constantly changing over different dimension (ie. time-wise and system-wise)
- Skew
- Schema Skew
- Online/offline Skew
- Distribution Skew
- Drift
- Data Drift
- Concept Drift
- Skew
- Drift causes model decay
- Performance of the model degrade over time because the world is a dynamic environment and moving away from the data that the model was initially trained on
Types of Drifts
Changes over time.
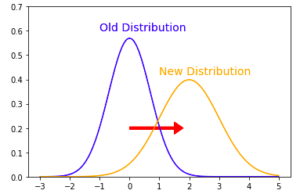
- Data Drift
- The distribution of the features P(X) changes over time
- The system is receiving different input over time (ex: the sensor is moved from one location to another)
- P(X) – feature drift
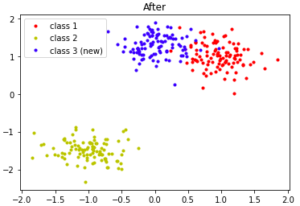
- Concept Drift
- The distribution of the relationship between features and label P(Y) and P(Y|X) changes over time
- The real world is changing. Even the input might stay the same but the output is not long the same (ex: fashion changes).
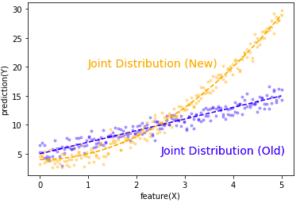
- Note that in the graph above the distribution of X is still uniform in both the New and Old case
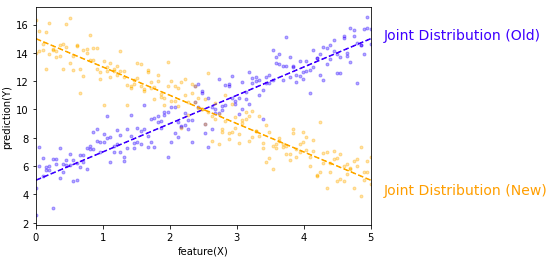
- P(Y|X) – sometimes called “real concept drift” or “conditional drift”
- In some case the distribution of X and Y can still be unchanged but P(Y|X) is still changed. In below chart, both the marginal distribution of X and and marginal distribution of Y are mostly uniform before and after the concept drift, but the relationship is clearly flipped.
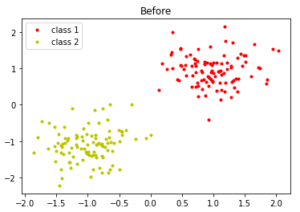
- Concept emergence
- New label, new type of distribution
- Label (prediction) drift
- P(Y) changes
- It might be due to concept drift or just purely label drift
Skews are similar to drift but in different context
Data skew and data drift are orthogonal concept but they can be related. The skew itself can be a static number but skew can widen overtime which can be caused by Data/Concept Drift.
Schema Skews
The training and serving data sources do not conform to the same schema, even though they should be the concept the same data set.
Online/offline Skew
This can be caused by system-wise differences in production ML
- Difference in data source during online and offline setting
- Difference in the library used in the online and offline system
One solution to this is a data store
Distribution Skews
The training and serving data sources have different distributions, even though they should be the concept the same data set. It can caused by
- The difference between the training data pipeline vs the serving application code (feature skew)
- Faulty sampling in training that is not representative in serving
- Data changes (distribution skew) between the time of training and time of serving because no matter how tightly you run the training, some time has passed when the system gets to serving.
- Trend, seasonality
- A feedback loop between the model and the algorithm. Your model prediction has an influence in the real world that affects the future data distribution in serving (ex: stock price prediction and portfolio management)
The types of distribution skews
- Dataset shift
- The statistical property of the features and label P(X,Y) change over time
- Covariate shift (aka data shift)
- Marginal probability P(X) is changed between training and serving
- Concept shift
- Conditional probability P(Y|X) is changed between training and serving
- Label shift (prior probability shift)
- The distribution of label P(Y) changes between training and serving
Note that the term shift can be confused with drift, but the term shift here is not about the environment/system aspect but not the difference caused by time.
To measure distribution skews, we can use the L-infinity distance (Chebyshev Distance) – the largest magnitude difference among all dimensions
Monitoring and detecting drifts and skews
Prerequisites
- The system needs to log all incoming features and predictions of the request and response
- Log the ground truth as well of the associated request, which can be used as additional training data (this is for detecting label drift)
Statistical methods to actually detect it
- Supervised monitoring
- Statistical Process Control – used in manufacturing quality control
- Assumed data is stationary
- Model error as binomial variable (or normal distribution)
- Trigger a drift alert if the parameter of the data goes above some threshold
- Ex: measured_mean + measured_std > minimum_mean + 3*minimum_std
- Sequential Analysis
- Linear four rates should remain constant in the Contingency table
- precision – positive predictive value
- recall/sensitivity – true positive value
- negative predictive value
- specificity/selectivity – true negative value
- Linear four rates should remain constant in the Contingency table
- Adaptive windowing
- Measure error distribution
- Calculate mean error rate at every window
- Compare the difference between successive window against the Hoeffding bound
- Statistical Process Control – used in manufacturing quality control
- Unsupervised monitoring
- Clustering/novelty detection
- Assign data to known cluster and detect emerging concept
- Ex: GC3
- Degrades with curse of dimensionality
- Feature distribution monitoring
- Monitoring each feature separate at each window of data
- Pearson correlation – assuming normal distribution
- Hellinger distance – non-parametric
- Use KL divergence
- Clustering/novelty detection
- Model dependent monitoring
- MD3 – Margin Density Drift Detection
- Monitors the number of samples in a classifier’s region of uncertainty (its margin), to detect drifts
- The margin area matters more for the classifier
- Reduce false alarm effectively
- MD3 – Margin Density Drift Detection
Mitigate model decays
- Determine the portion of the dataset that is still valid
- Use unsupervised method
- KL Divergence
- JS Divergence (Jensen-Shanon)
- a symmetrized and smoothed version of KL Divergence
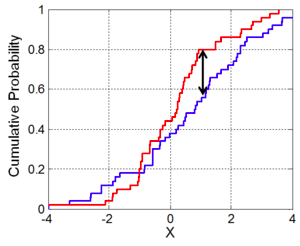
- KS Test (Komogorov Smirnov)
- empirical based CDF distance
- compare the maximum distance against a critical value as a function of the sample size
- This is needed if you don’t have a lot of new data; otherwise you can discard everything
- Use unsupervised method
- Retrain the model with new dataset
- Fine tune from last checkpoint
- Start over depending on the drift
- Define retraining policy
- Rethink feature engineering, feature selection
- Retry new model architecture
- Redesign entire pipeline if performance degrade significantly
- Retraining with pipeline
- When the data can change rapidly, having a pipeline for retraining become a requirement