The KL (Kullback–Leibler) Divergence and JS (Jensen-Shanon) Divergence are ways to measure the distance (similarity) between two distributions P and Q. I will try to provide some examples to help gain some intuition to understand these two distance metrics.
Example (continous)
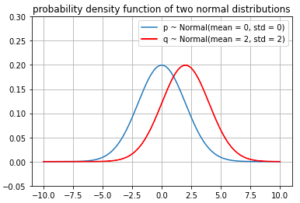
We start with an example of two normal distribution
- P ~ Normal(mean = 0, std = 2)
- Q ~ Normal(mean = 2, std = 2)

Since P and Q are continuous distributions,
![]()
This can also be expressed as

Note: you might be tempted to think that the two integrals are the H(P,Q) and H(P), but it’s not the case, or rather beyond the scope of this article (also beyond my understanding of the material).
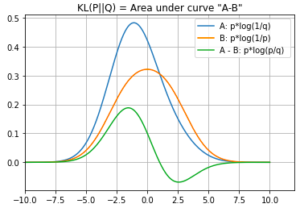
Nevertheless, we can still plot the two components inside the KL divergence integral expression

Points to take note
- A: the area under the orange curve represents the cross entropy: the expected number of bits of information needed to describe an event drawn from the distribution P if the encoding scheme is optimized on the distribution Q
- B: the area under the blue curve represents the amount of information from the original P distribution
- which is also called self entropy: the expected number of bits of information needed to describe an event drawn from the distribution P if the encoding scheme is optimized on the distribution P
- A – B: The area under the green curve is the KL divergence “from Q to P”
- If P and Q have the same distribution, then A=B, and the KL divergence would be equal to 0
- A is always greater than or equal to B. Why?
- Because B represents the most efficient encoding scheme (minimal number of bits) that works for distribution Q, so there is no way for this encoding scheme more efficient (small number of bits), so A must be a large value (more bits = less efficient)
Discrete Example
Discrete distribution is actually more natural to apply to the Shannon’s entropy definition since we are talking in bits after all.
One thought on “KL (Kullback–Leibler) Divergence and JS (Jensen-Shanon) Divergence”